16. Overview — analytics dashboard
Overview is de hoofdpagina van de admin, het eerste wat je ziet na login. Een dashboard met vier secties.
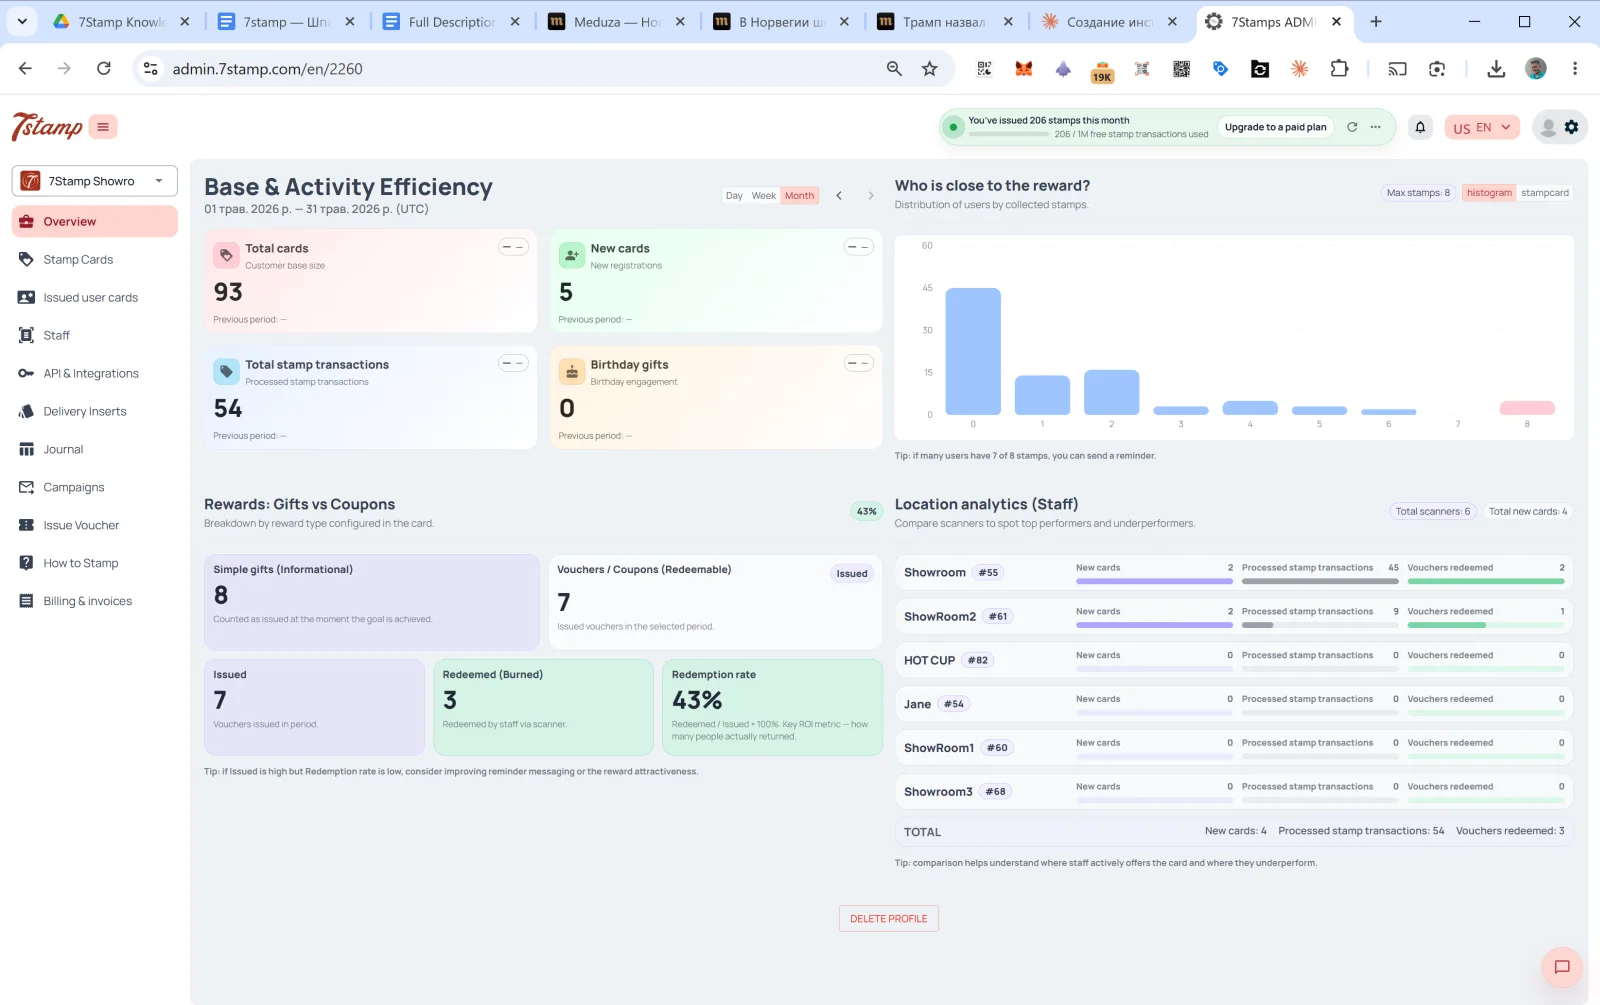
16.1 Base & Activity Efficiency
Base activity voor de gekozen periode. Switch rechtsboven: Day / Week / Month (default Month), arrows ← → voor navigation.
Vier cards:
- Total cards — totale customer base.
- New cards — nieuwe registrations in de periode.
- Total stamp transactions — verwerkte Stamp transactions.
- Birthday gifts — birthday engagement.
Elke card heeft een comparison met previous period.
16.2 Who is close to the reward?
Een histogram van customer distribution per verzameld aantal Stamps. De X-axis is Stamp count, de Y-axis is het aantal customers.
De hint: “if many users have 7 of 8 stamps, you can send a reminder.” Dit helpt hot segments vinden: klanten met nog 1–2 Stamps tot Reward komen het meest waarschijnlijk terug na reminder.
16.3 Rewards: Gifts vs Coupons
Split per issued Reward type:
- Simple gifts (Informational) — aantal issued Awards.
- Vouchers / Coupons (Redeemable) — aantal issued Vouchers:
- Issued — issued.
- Redeemed (Burned) — redeemed door staff via Scanner.
- Redemption rate —
Redeemed / Issued × 100%. De belangrijkste ROI metric.
Als Issued hoog is maar Redemption rate laag, ligt het probleem meestal bij reminders of aantrekkelijkheid van de gift.
16.4 Location analytics (Staff)
Staff / location performance comparison. Bovenaan staan Total scanners en Total new cards.
Per Staff:
- Name +
#ID. - New cards.
- Processed stamp transactions.
- Vouchers redeemed.
Onderaan staat TOTAL over alle staff.
Deze block is een belangrijk management tool. Als één locatie veel Stamps heeft en een andere nul, is dat een signaal: staff biedt de card niet actief aan of heeft een technisch scanner-probleem.
Visual walkthrough
Use the screen sets below as a visual companion to the article. Open any image to inspect it at full size.